What Really Affects
Academic Performance?
A data-driven investigation into how sleep, social media, study habits, and class preferences shape CGPA — using real survey data from 54 DIU students.
Enter your real habits below. Both regression models trained on actual DIU survey data run instantly in your browser — and you'll get a personalised suggestion based on your inputs.
—
# ══════════════════════════════════════════════════════════════════════
# What Really Affects Academic Performance? — Full Model Training Code
# CSE-328 · Daffodil International University · Section 65_B · 2026
# n=54 cleaned survey responses | Python 3.12, Pandas, Scikit-learn
# ══════════════════════════════════════════════════════════════════════

import pandas as pd
import numpy as np
from sklearn.linear_model import LinearRegression, LogisticRegression
from sklearn.metrics import (r2_score, mean_squared_error,
                             accuracy_score, classification_report)

# Load cleaned dataset
df = pd.read_csv('academic_survey_clean.csv')

# Ordinal encoding
study_map  = {'Less than 1hr':1, '1-2hrs':2, '3-4hrs':3, '5+hrs':4}
sleep_map  = {'Less than 5hrs':1, '5-6hrs':2, '7-8hrs':3, '8+hrs':4}
social_map = {'Less than 1hr':1, '1-2hrs':2, '3-4hrs':3, '5+hrs':4}
conc_map   = {'Never':1, 'Sometimes':2, 'Often':3, 'Always':4}
class_map  = {'Online':1, 'No Preference':2, 'Offline':3}
cgpa_map   = {'Below 2.5':1, '2.5-2.99':2, '3.00-3.49':3, '3.5-4.00':4}

df['Study_Hours']  = df['Study_Hours'].map(study_map)
df['Sleep_Hours']   = df['Sleep_Hours'].map(sleep_map)
df['Social_Media']  = df['Social_Media'].map(social_map)
df['Concentration'] = df['Concentration'].map(conc_map)
df['Class_Pref']    = df['Class_Pref'].map(class_map)
df['CGPA_encoded']  = df['CGPA'].map(cgpa_map)

features = ['Study_Hours', 'Sleep_Hours', 'Social_Media', 'Concentration', 'Class_Pref']
X = df[features]
y_linear = df['CGPA_encoded']
y_logistic = (df['CGPA_encoded'] >= 4).astype(int)

# Linear Regression
lr_model = LinearRegression()
lr_model.fit(X, y_linear)

y_pred_lr = lr_model.predict(X)
r2 = r2_score(y_linear, y_pred_lr)
rmse = np.sqrt(mean_squared_error(y_linear, y_pred_lr))

print("Linear Regression")
print(f"Intercept: {lr_model.intercept_:.3f}")
for feat, coef in zip(features, lr_model.coef_):
    print(f"{feat}: {coef:+.3f}")
print(f"R²: {r2:.3f}")
print(f"RMSE: {rmse:.3f}")

# Logistic Regression
log_model = LogisticRegression(max_iter=1000, random_state=42)
log_model.fit(X, y_logistic)

y_pred_log = log_model.predict(X)
acc = accuracy_score(y_logistic, y_pred_log)

print("
Logistic Regression")
print(f"Intercept: {log_model.intercept_[0]:.3f}")
for feat, coef in zip(features, log_model.coef_[0]):
    print(f"{feat}: {coef:+.3f}")
print(f"Accuracy: {acc:.1%}")
print(classification_report(y_logistic, y_pred_log, target_names=['Lower CGPA', 'High CGPA']))

# Prediction helper
def predict_student(study, sleep, social, conc, class_pref):
    x_new = np.array([[study, sleep, social, conc, class_pref]])

    lr_raw = lr_model.predict(x_new)[0]
    lr_score = np.clip(lr_raw, 1, 4)
    bands = {1:'Below 2.5', 2:'2.50–2.99', 3:'3.00–3.49', 4:'3.50–4.00'}
    lr_band = bands[int(np.clip(round(lr_score), 1, 4))]

    prob_high = log_model.predict_proba(x_new)[0][1]
    verdict = 'High CGPA (≥3.5)' if prob_high >= 0.5 else 'Lower CGPA'

    print(f"Linear score: {lr_score:.3f} -> Band: {lr_band}")
    print(f"P(High CGPA): {prob_high:.1%} -> {verdict}")
Collected
After Cleaning
Analyzed
Applied
Social Media 5+ hrs
Understanding the drivers of academic performance is critical — not just for grades, but for scholarship eligibility, career outcomes, and on-time graduation. We investigated four specific sub-questions:
Does the number of daily study hours significantly relate to CGPA? We hypothesize a moderate positive correlation.
Does sleeping 7–8 hours per night lead to measurably better outcomes compared to sleeping under 5 hours?
Does heavy daily social media usage (5+ hours) reduce concentration, and does this affect CGPA?
Do students who prefer offline classes perform better academically than those preferring online instruction?
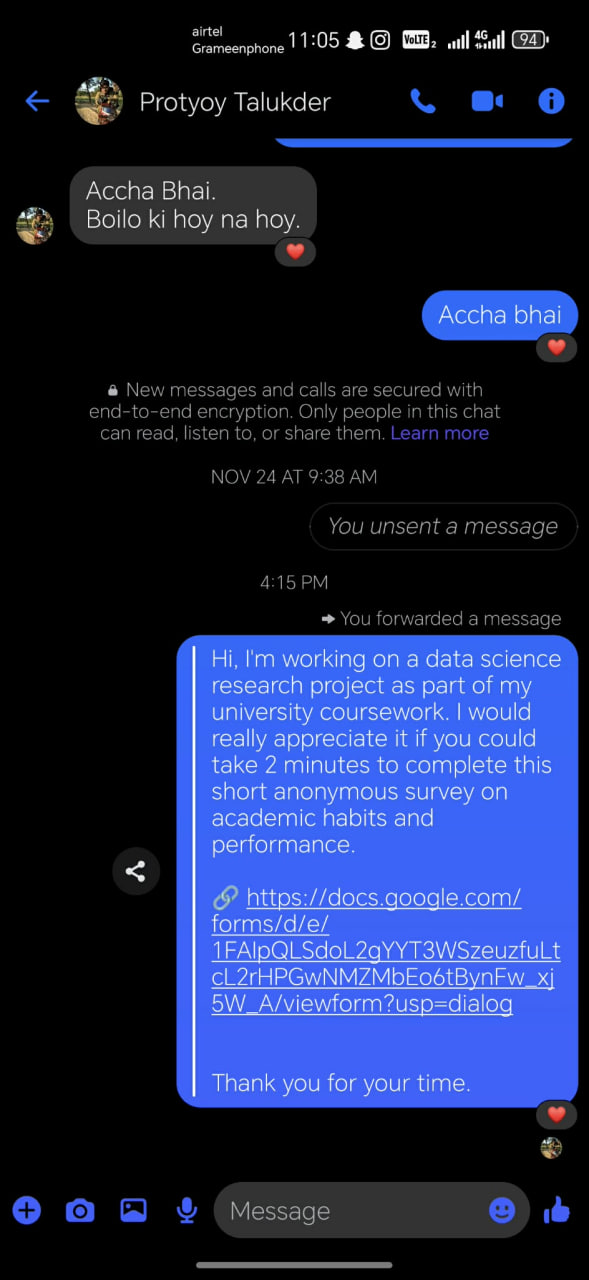
Data collected via Google Forms across Telegram (2,700+ subscribers), WhatsApp Community, and Facebook Messenger — targeting DIU students aged 18–27 between April 3–4, 2026.
| Feature | Type | Values | Role |
|---|---|---|---|
| Age Group | Categorical | Under 18, 18–20, 21–23, 24–26, 27+ | Demographic |
| Gender | Categorical | Male, Female, Other | Demographic |
| CGPA ★ | Ordinal | Below 2.5 → 3.5–4.00 (encoded 1–4) | Target |
| Study Hours | Ordinal | <1 hr, 1–2 hrs, 3–4 hrs, 5+ hrs | Predictor |
| Sleep Hours | Ordinal | <5 hrs, 5–6 hrs, 7–8 hrs, 8+ hrs | Predictor |
| Class Preference | Categorical | Online, Offline, No Preference | Predictor |
| Social Media | Ordinal | <1 hr, 1–2 hrs, 3–4 hrs, 5+ hrs | Predictor |
| Concentration | Ordinal | Never, Sometimes, Often, Always | Predictor |
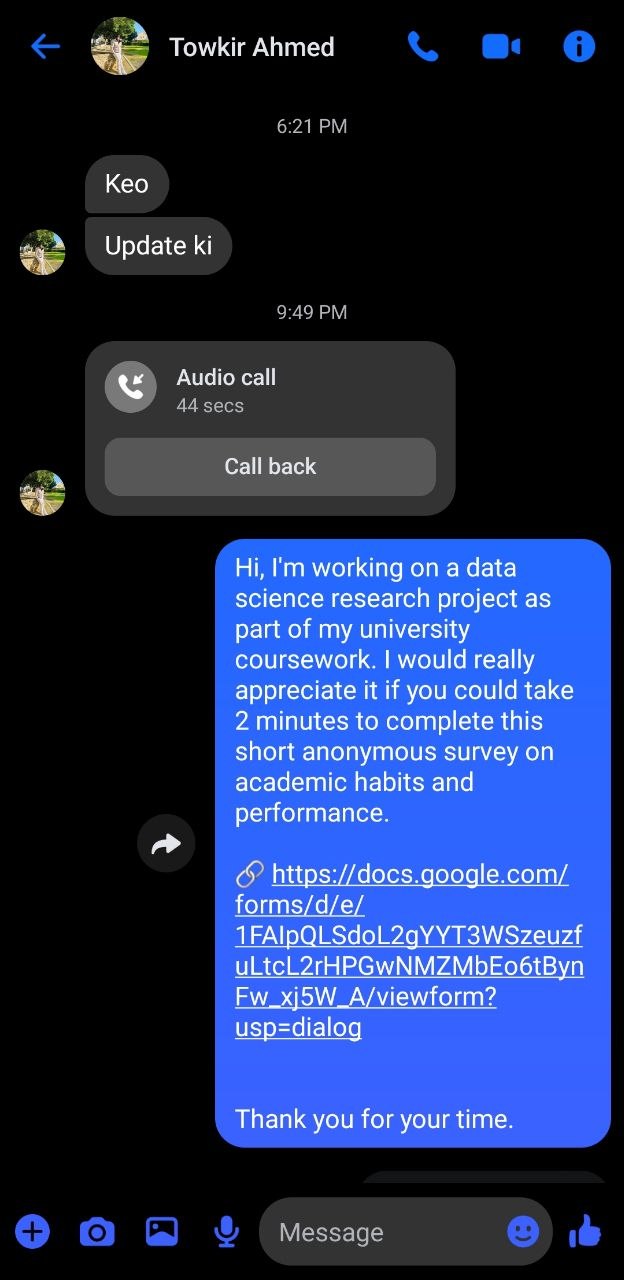
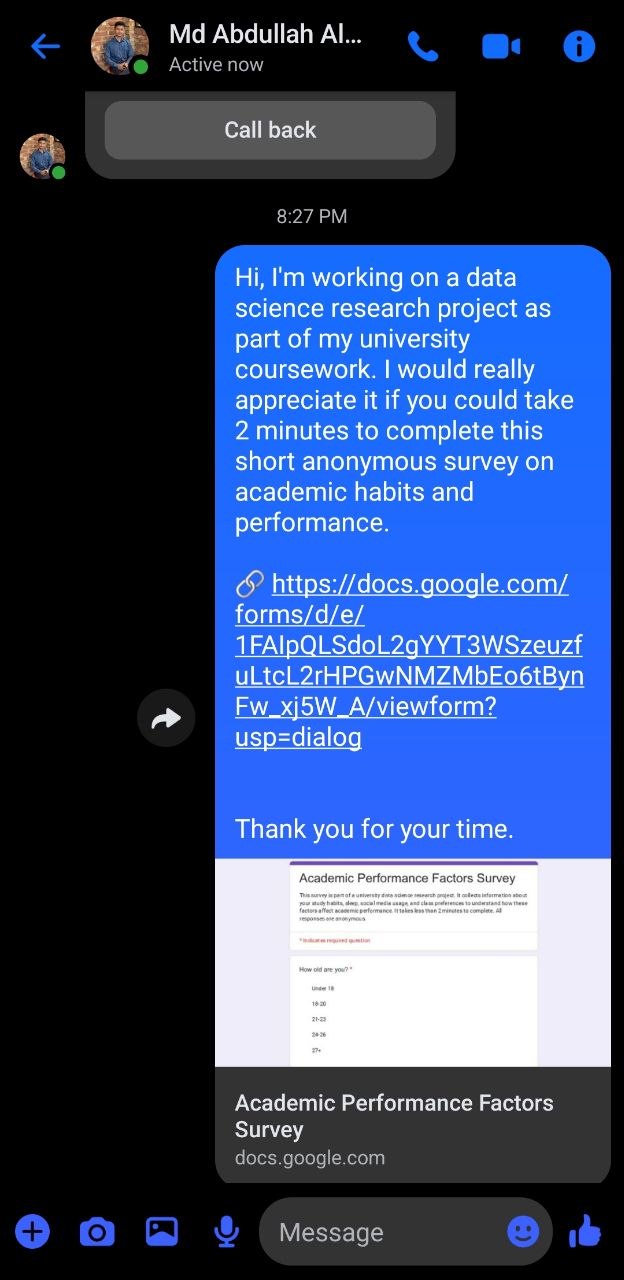
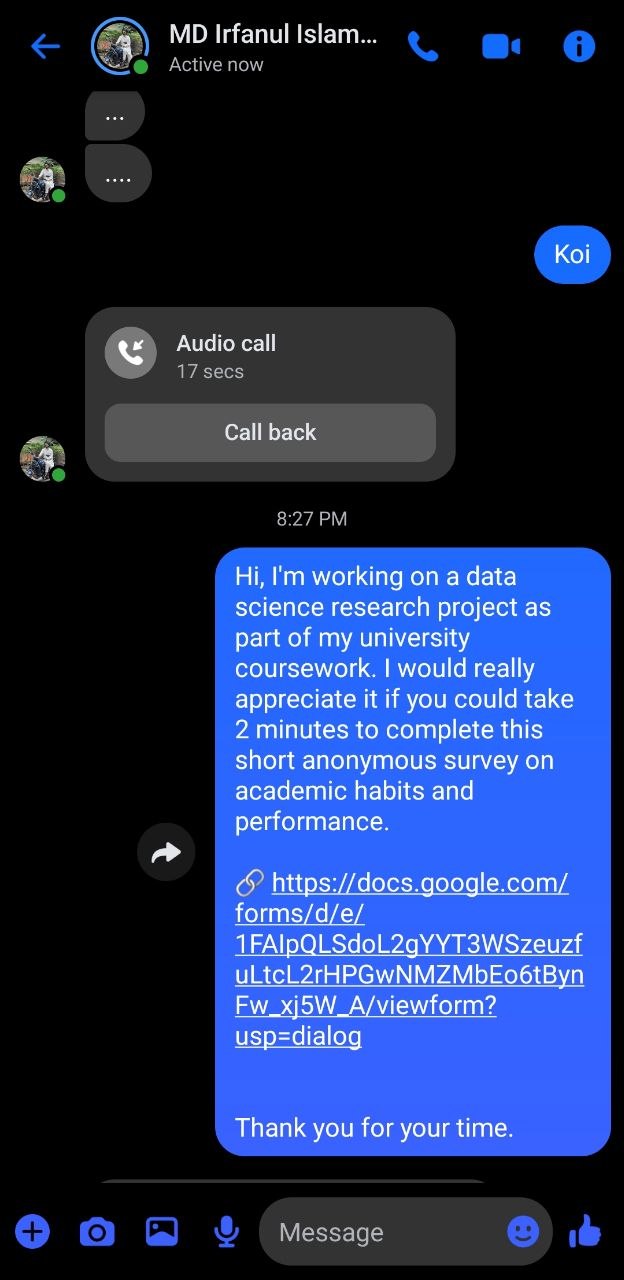
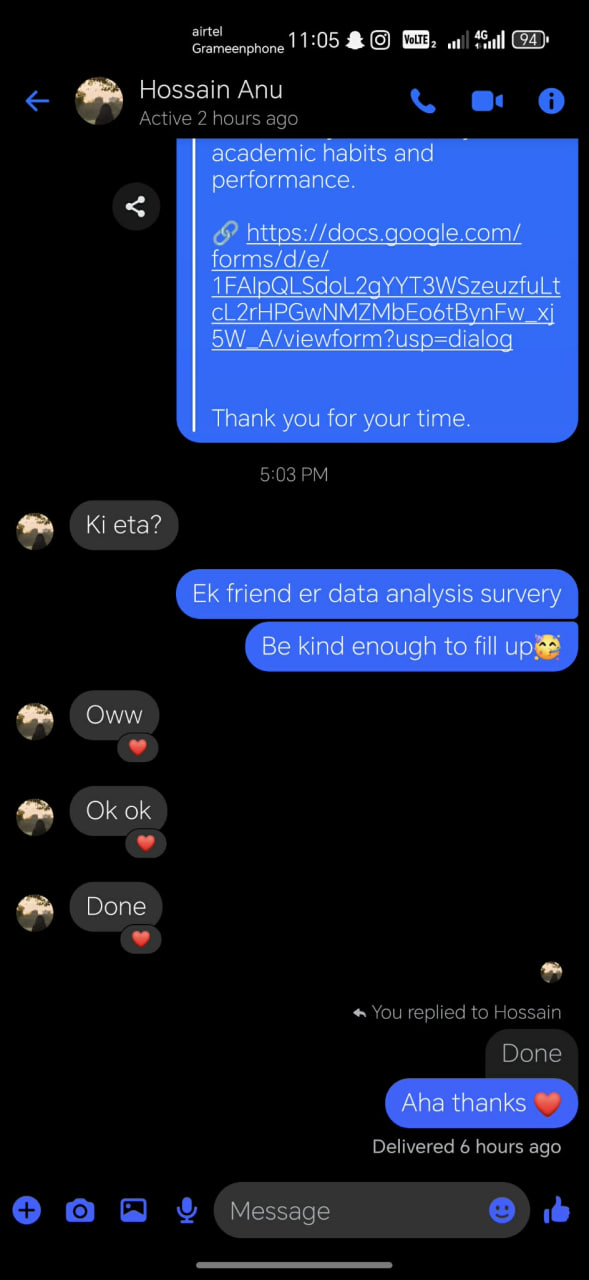
We utilized Telegram, WhatsApp, and Facebook Messenger direct communications for primary data collection. The survey link was distributed through group channels and one-to-one conversations to reach real university students and collect authentic responses. The slots below are arranged to showcase seven examples of our collection methods.